Regression classification explained — Meta Description: Learn how regression and classification algorithms work and when to use them.
Regression and Classification are the two pillars of supervised learning. While both are predictive models that learn from labeled data, they address different types of problems. Mastering both is essential for any Machine Learning practitioner.
Understanding Regression
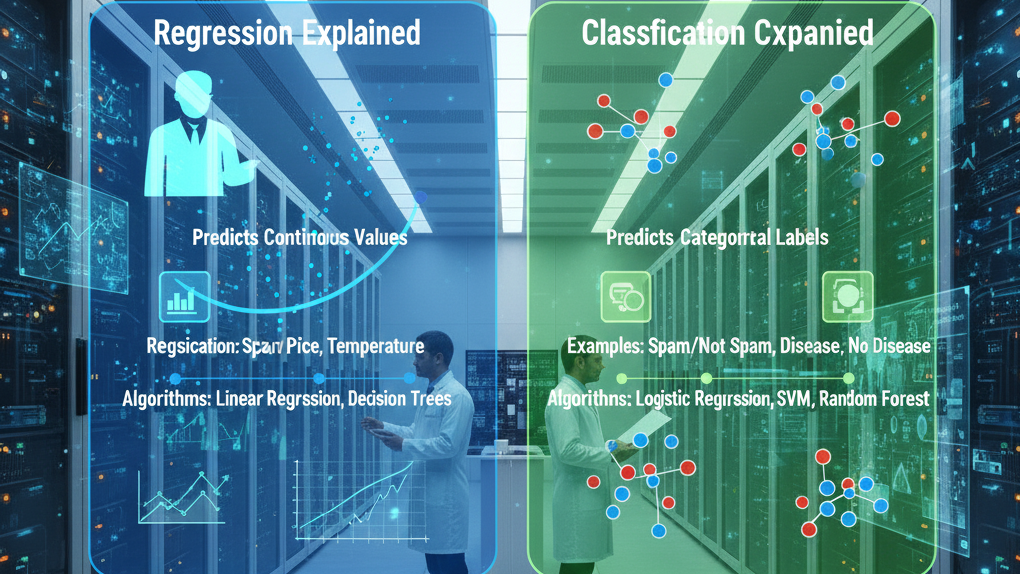
Regression is used when you want to predict continuous numerical values. Continuous means values can fall anywhere on a spectrum, not just discrete categories.
How Regression Works
Imagine predicting house prices. Given features like square footage, bedrooms, and location, you want to estimate a price. The price could be 250,000 or 350,500 or any value in between, not just “cheap” or “expensive.”
Regression algorithms learn the underlying relationship between input features and continuous output values. The simplest form, Linear Regression, fits a line through data points to make predictions.
Real-World Regression Applications
Financial Forecasting predicts stock prices or market trends. Real Estate estimates property values. Healthcare predicts patient recovery times. Energy Consumption forecasts power usage. Salary Prediction estimates wages based on experience and education.
Common Regression Algorithms
Linear Regression assumes a linear relationship between inputs and output and is simple and interpretable. Polynomial Regression fits higher-degree polynomials for non-linear relationships. Support Vector Regression uses advanced techniques for complex, non-linear relationships. Decision Tree Regression splits data into regions assigning the average value of each region. Random Forest Regression combines multiple trees reducing overfitting.
Evaluating Regression Models
Mean Absolute Error shows the average absolute difference. Mean Squared Error penalizes larger errors more heavily. Root Mean Squared Error is in the same units as the target variable. R² Score measures how well the model explains variance.
Understanding Classification
Classification predicts which category an item belongs to. Unlike regression’s continuous values, classification outputs discrete categories or classes.
How Classification Works
Imagine building an email filter. An email must be classified as either “spam” or “legitimate”, nothing in between. Classification algorithms learn to distinguish between predefined categories based on features.
Real-World Classification Applications
Medical Diagnosis classifies tumors as benign or malignant. Fraud Detection identifies fraudulent vs. legitimate transactions. Sentiment Analysis classifies reviews as positive, negative, or neutral. Image Recognition identifies objects, faces, or animals. Spam Detection filters spam from legitimate emails. Customer Categorization segments customers as high-value, medium, or low-value.
Types of Classification
Binary Classification has two classes like spam or not spam. Multi-class Classification has more than two classes like cat, dog, or bird. Multi-label Classification allows instances to belong to multiple classes.
Common Classification Algorithms
Logistic Regression creates probability boundaries between classes and is interpretable for binary classification. Decision Trees recursively split data and are intuitive. Random Forests reduce overfitting by combining multiple trees. Support Vector Machines find optimal hyperplanes separating classes. Naive Bayes applies probability theory and is fast. K-Nearest Neighbors classifies based on nearest neighbors. Neural Networks handle complex patterns.
Evaluating Classification Models
Accuracy shows the percentage of correct predictions. Precision shows of predicted positives how many were actually positive. Recall shows of actual positives how many we caught. F1-Score balances precision and recall. Confusion Matrix shows true positives, true negatives, false positives, and false negatives. ROC Curve shows the trade-off between true positive and false positive rates.
Regression vs. Classification: Key Differences
Regression outputs continuous values, Classification outputs discrete categories. Regression predicts how much, Classification predicts which category.
When to Use Each
Use Regression when your target is continuous, you want exact values, the problem involves forecasting, or you’re doing estimation. Use Classification when your target is categorical, you want to assign categories, the problem involves categorization or detection.
Hybrid Scenarios
You can convert regression output to classes or use classification as intermediate steps for regression.
Conclusion
Regression and classification are fundamental tools in your Machine Learning toolkit. Regression answers how much, Classification answers which category. Ready to explore more algorithms? Check out our guide on Top Machine Learning Algorithms.
Continue learning
← Back to Machine Learning Essentials
Next: Top Machine Learning Algorithms
Key Benefits of Regression and Classification Explained
Understanding the core advantages helps you make informed decisions and implement the right approach for your specific context. Here are the most significant benefits that practitioners consistently report:
- Time savings at scale: Once properly configured, Regression and Classification Explained reduces manual effort by 60-80% on repetitive tasks, freeing your team to focus on high-value creative and strategic work.
- Consistency and reliability: Unlike manual processes that vary based on who executes them and when, a well-built Regression and Classification Explained system delivers the same quality output every time, regardless of volume.
- Measurable ROI: The cost savings and output gains from Regression and Classification Explained are directly trackable. Most teams that implement it properly see a positive return within the first 30-60 days.
- Scalability without proportional cost: You can multiply output 5x or 10x without multiplying your team size or budget. This is the fundamental leverage that makes Regression and Classification Explained a competitive advantage.
- Reduced error rates: Automated and AI-assisted systems eliminate the class of errors that come from fatigue, distraction, and human inconsistency — particularly valuable in high-volume operations.
Common Mistakes to Avoid with Regression and Classification Explained
Most teams that struggle with Regression and Classification Explained are not failing because the technology doesn’t work — they’re failing because of predictable, avoidable mistakes. Here are the most common ones:
1. Trying to automate everything at once
The teams that succeed with Regression and Classification Explained start with one specific, well-defined process and get it working reliably before expanding. The teams that fail try to automate their entire operation in week one and end up with a fragile system nobody trusts.
2. Skipping the process documentation phase
Before you can automate or optimize a process, you need to understand exactly how it works today. Teams that skip this step build systems that automate the wrong version of the process — including all its existing inefficiencies.
3. Not defining success metrics upfront
If you don’t know what “working well” looks like before you start, you’ll never know if your implementation of Regression and Classification Explained is actually delivering value. Define 2-3 concrete metrics before you build anything.
4. Underinvesting in the human review layer
The most effective Regression and Classification Explained implementations keep humans in the loop at the right decision points. Removing all human oversight to maximize automation speed is how quality problems compound silently until they become crises.
5. Not planning for maintenance
Every system requires ongoing maintenance. APIs change, data structures evolve, business requirements shift. Budget time and responsibility for keeping your Regression and Classification Explained system current — it’s not a one-time build.
Recommended Tools for Regression and Classification Explained in 2026
The right tools make the difference between a fragile prototype and a production-grade system. These are the tools most consistently used by practitioners who have built reliable Regression and Classification Explained workflows:
- Make.com — The automation backbone for connecting tools and building workflow logic without code. Handles complex branching, error handling, and data transformation better than alternatives at this price point.
- Claude (Anthropic) — Best for structured reasoning, long-form content tasks, and workflows requiring consistent output quality. Particularly strong for tasks that need nuanced judgment rather than just speed.
- n8n — The self-hosted alternative to Make for teams that need full data control or want to avoid per-operation pricing. Steeper learning curve, significantly lower cost at scale.
- Airtable or Notion — For managing the data layer of your workflow: tracking inputs, outputs, approvals, and status without building a custom database.
- RankMath or Yoast — For any workflow that touches WordPress content, these plugins provide the API hooks needed to update SEO metadata, schedule posts, and manage publishing programmatically.
The specific combination you choose matters less than ensuring the tools integrate cleanly with each other. Before committing to any stack, verify that the data can flow between tools in the format each tool expects.
Frequently Asked Questions
What is the most important thing to get right with Regression and Classification Explained?
Clarity on the problem you’re solving before you start building. The teams that struggle most are the ones that start building before they have a precise definition of the outcome they want to achieve.
How do I measure success?
Define 2-3 concrete metrics before you start: time saved per week, error rate reduction, output volume increase. Measure these from day one so you can demonstrate value and know when to optimize.
How do I get buy-in from my team or leadership?
Run a small, time-boxed pilot on a low-risk process. Measure the results. Present the numbers. Nothing convinces faster than a working proof of concept with real data from your own operation.
Where should I start if I’m new to Regression and Classification Explained?
Start with a process you already understand well and that has a clear, measurable output. Don’t start with your most complex or most critical process. Start with something you can afford to get wrong, learn from, and redo. That first build teaches you more than any course or guide.
Final Thoughts on Regression and Classification Explained
The gap between teams that benefit from Regression and Classification Explained and teams that don’t is rarely about access to tools or budget. It’s about approach. The teams that succeed treat it as a discipline — something they learn systematically, implement incrementally, and improve continuously. The teams that fail treat it as a switch they can flip once and forget.
If you take one thing from this guide: start smaller than you think you should. Pick the most contained, well-understood process in your operation. Build it. Measure it. Then expand. Every large-scale Regression and Classification Explained system you’ve ever admired was built the same way — one reliable module at a time.
The tools in 2026 are better than they’ve ever been. The information is more accessible than ever. The only variable left is whether you act on it.