How to Automate Your Data and Reporting with AI (Save 100+ Hours a Year)
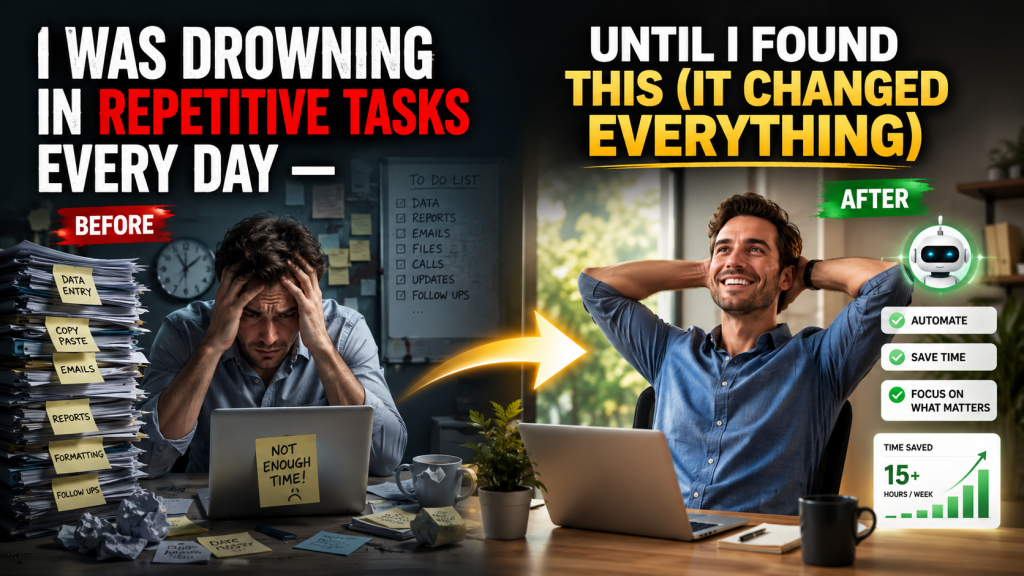
Automate data reporting — There is a type of work that never gets done. You pull the numbers, copy them from one place and paste them somewhere else, build a table, write a summary, send it. Next week you do the exact same thing from the beginning. Then the week after. Then the week after that.
If you run a digital business and work with clients, track your site performance, or monitor campaigns, you know this feeling. Reporting eats time you don’t notice losing because it feels necessary — but most of it can run on its own.
I built a system that collects my data, analyzes it, and sends reports automatically. The time I used to spend on this every week dropped from three hours to twenty minutes of review.
The Real Problem With Manual Reporting
Manual reporting has three problems that don’t show up immediately.
The first is human error. When you copy numbers manually from multiple sources, mistakes are inevitable. One wrong number in a client report costs you their trust — and that’s worth far more than the time it takes to build an automated system that eliminates the risk entirely.
The second is delay. Manual reporting means your data is always days old by the time anyone reads it. An automated system gives you daily or even real-time data with zero additional effort. The decisions you make on fresh data are simply better than the ones you make on last week’s numbers.
The third is cognitive drain. Copying numbers and formatting tables requires no real thinking — but it depletes your mental energy in ways you don’t always notice. An hour of mechanical data work leaves you feeling tired without having actually thought through anything important.
What Can Actually Be Automated in a Data Operation
Every data operation moves through three stages — collection, analysis, and reporting. Each stage has parts that can be automated without losing any of the judgment that matters.
Data collection is the most time-consuming mechanical stage. Instead of opening each tool manually, exporting data, and consolidating it somewhere, an automated system pulls data from Google Analytics, Search Console, your SEO tools, and your social accounts and deposits everything into a single Google Sheet — every morning, automatically, before you’ve opened your laptop.
Data analysis is where AI changes the game. Once the numbers are collected, Claude or GPT-4o reads them and extracts what matters — the trends, the anomalies, the early warning signs. The output isn’t a table of numbers. It’s a plain-language summary a human actually wrote — because in a sense, one did. If you want to understand how to connect AI models directly to this kind of workflow, the full technical setup is in How to Connect Claude and GPT-4o to Your Business Workflow.
Reporting and delivery is the final stage. After the analysis is done, a workflow generates a formatted report and sends it — to you, to your team, or directly to clients — at the scheduled time every week. The report arrives before you think to ask for it.
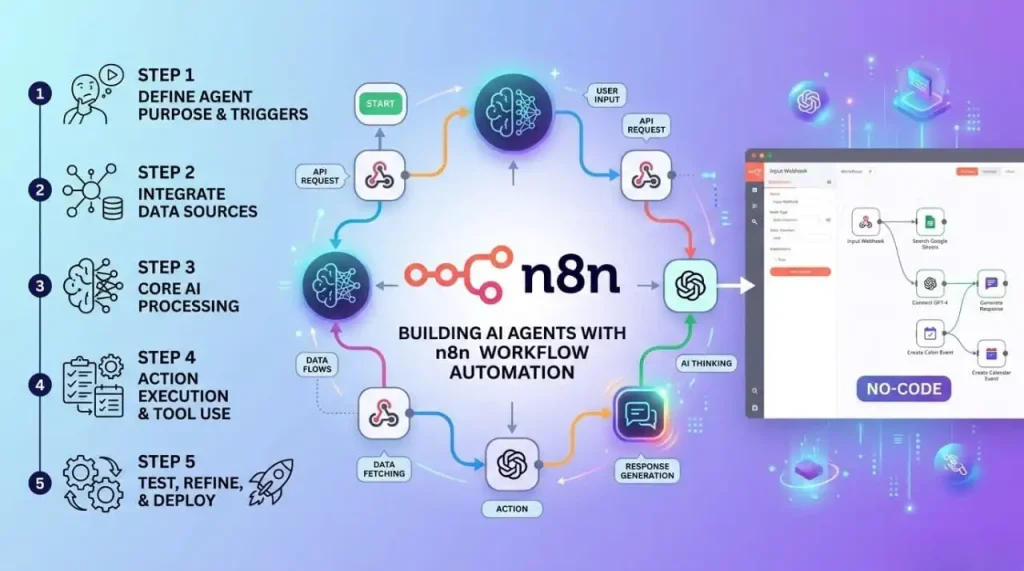
How to Build the System, Step by Step
The first step is identifying your data sources. Write down every place you currently pull numbers from. Google Analytics, Search Console, Facebook Ads, SEO tools, sales data. These are the inputs your system will collect automatically.
The second step is choosing your data hub. Google Sheets is the best starting point — free, flexible, and it integrates with everything. Notion works well if you want a cleaner presentation layer. Either one becomes the central place where all your data lives before the AI touches it.
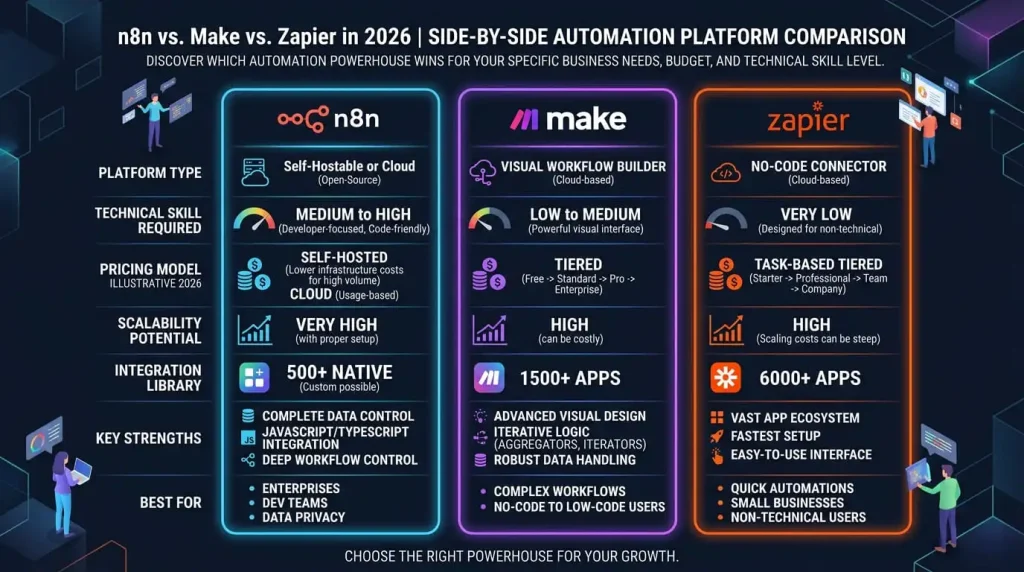
The third step is building the collection layer. Make connects every data source to your Google Sheet automatically. Every morning the sheet updates itself with numbers from every platform — without you opening a single app. For a detailed comparison of Make and Zapier to decide which fits this use case better, I covered that in Make vs Zapier: Which Automation Tool is Actually Worth It in 2026.
The fourth step is building the AI analysis layer. A second workflow takes the collected data and sends it to Claude with a clear prompt — something like: “Analyze this week’s data, identify the three most important trends, flag any metrics that need attention, and write a plain-language summary a non-technical client can understand.” The output is a human-readable insight layer on top of your raw numbers.
The fifth step is building the delivery layer. A final workflow takes the analyzed report and sends it via email at the right time each week — to whoever needs it. You don’t schedule it. You don’t open Gmail. The report goes out whether you’re in a meeting, on a flight, or still asleep.
For the complete picture of how this fits into a fully automated business operation, everything is in The Complete Guide to AI Automation and Workflows in 2026.
The Real ROI of This System
If you spend two hours a week on reporting, you spend 104 hours a year on a task that can be automated. At $50 an hour, that’s $5,200 worth of your time going into mechanical work every year. The system takes two days to build, once.
But the more important return isn’t the hours saved. It’s the quality of the decisions you make when your data is current, analyzed, and waiting for you every morning instead of sitting in a spreadsheet you haven’t updated since Tuesday.
Speed of insight is a competitive advantage. The business owner who sees a problem in their data on Monday and fixes it by Wednesday beats the one who notices it three weeks later when they finally get around to pulling the report.
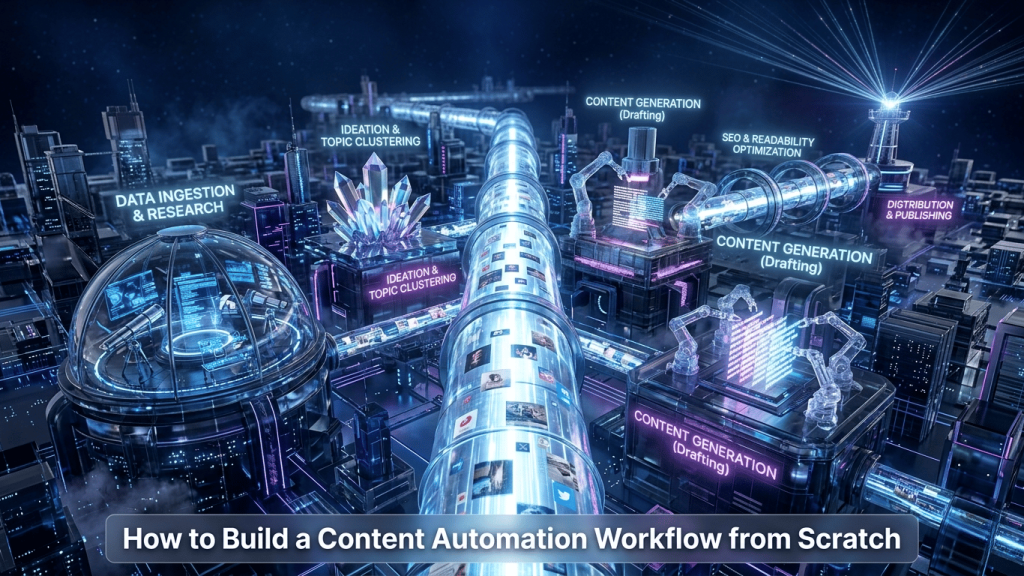
This is also where content automation and data automation start to reinforce each other. When you can see in real time which articles are driving traffic and which topics are converting, you make better content decisions. I covered how to build that content system in How to Build a Content Automation Workflow from Scratch.
And for anyone managing client communication alongside all of this, the automation system for that side of the business is in How to Automate Your Client Communication with AI.
If you’re completely new to building workflows and want to start with something simple before tackling a full data pipeline, the right entry point is The Beginner’s First Workflow: From Zero to Automated in One Day.
FAQ
Does this system require technical skills? No. Make, Google Sheets, and AI work together without writing a single line of code. If you can use a spreadsheet, you can build this. The logic takes a day to understand. The system takes two days to build.
How much data can this system handle? Make’s free plan handles the volume of a small to mid-size business comfortably. As your data volume grows, the paid plan scales with it. Google Sheets handles up to 10 million cells — more than enough for any reporting operation at this level.
Can reports be sent directly to clients? Yes, and this is one of the highest-value applications of this system. Each client gets a customized report pulling their specific data, formatted for their context, delivered on schedule — automatically. Clients perceive this as a premium service. It costs you nothing after the initial setup.
Which data sources does this system support? Google Analytics, Search Console, Facebook Ads, Google Ads, Ahrefs, SEMrush, and any tool with an API or CSV export. Make integrates directly with most of them. For tools without a native Make integration, a CSV export workflow handles the rest.
How long does it take to build this system? One day for a basic version covering one data source and one report. One week to expand it to multiple sources and multiple report formats. After that it runs indefinitely without maintenance beyond occasional checks.
Pull your last three weekly reports. Write down every manual step you took to produce them. That list is your automation roadmap.